“The environment in which all storms form has changed owing to human activities.”
– Dr. Kevin E. Trenberth, Distinguished Senior Scientist
What is the science behind climate change? What explains Category 5 hurricanes? Dr. Kevin E. Trenberth, Distinguished Senior Scientist in the Climate Analysis Section at the National Center for Atmospheric Research (NCAR), offered his perspective on these questions in his recent talk at the University of Denver Sturm College of Law.[1]
Dr. Trenberth obtained his Sc. D. in meteorology in 1972 from the Massachusetts Institute of Technology.[2] He was a lead author of the 1995, 2001 and 2007 Scientific Assessment of Climate Change reports from the Intergovernmental Panel on Climate Change (IPCC), and shared the 2007 Nobel Peace Prize, which went to the IPCC.[3]
The World Meteorological Organization (WMO) and the United Nations Environment Program (UNEP) established the IPCC in 1988.[4] The IPCC’s principal function is to provide policymakers with scientific bases for climate change, as well options for adaptation and mitigation.[5] Hundreds of experts contribute to the information needed to understand climate change in the IPCC reports.[6] The IPCC’s reports underlie negotiations under the United Nations Framework Convention on Climate Change (UNFCCC).[7] The Conference of the Parties (COP) meets annually to review the UNFCCC’s implementation and to adopt instruments ensuring its effective implementation.[8]
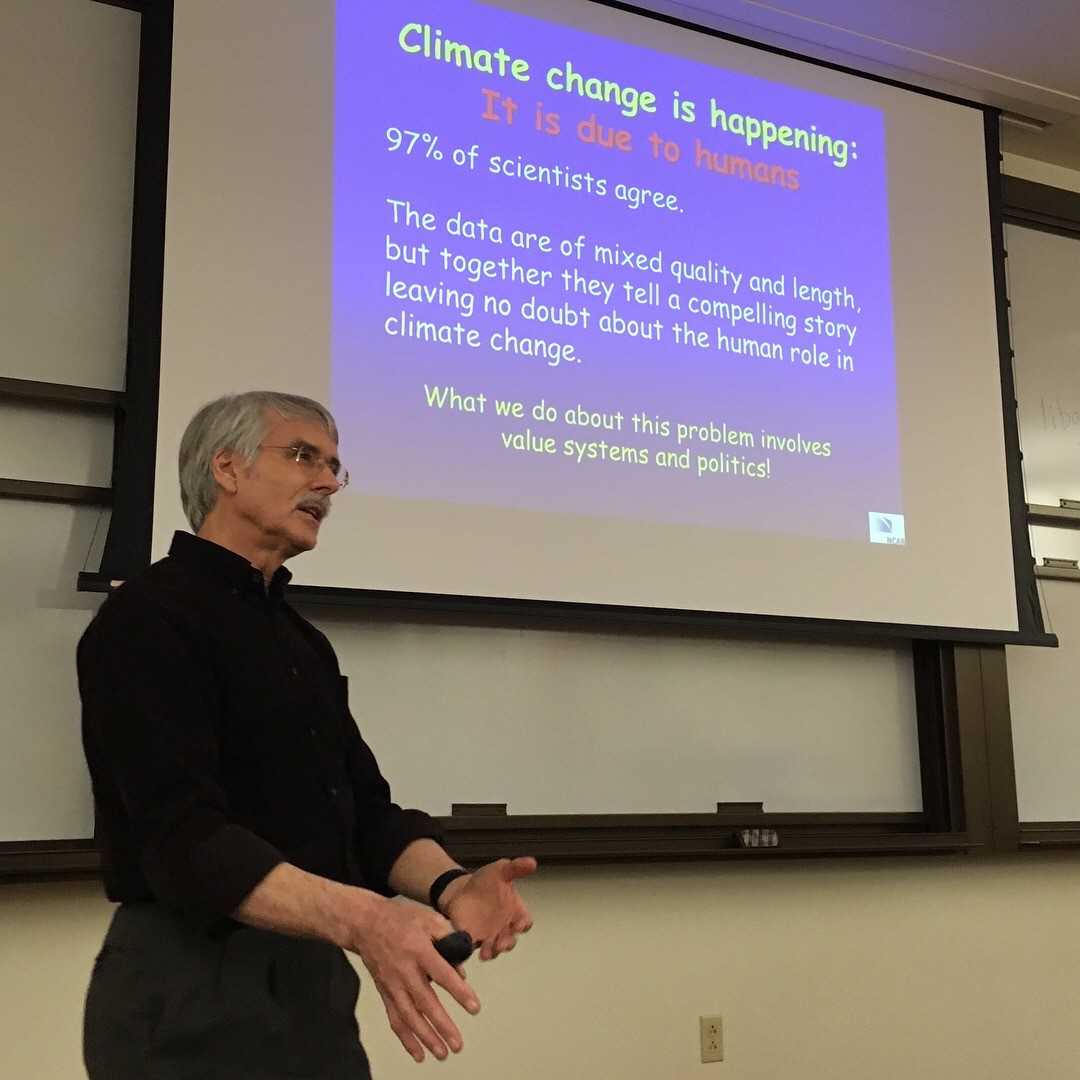
Dr. Trenberth acknowledges that the data on changes in the climate are of 700-802 mixed quality and length.[9] However, taken together, the data tells a compelling story about the extent of the human role in climate change.[10] Today, research on climate change demonstrates that 97 percent of “actively publishing climate scientists agree: Climate-warming trends over the past century are extremely likely due to human activities.”[11]
Observable Changes in Climate
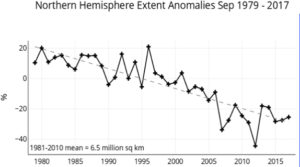
What have observed in terms of climate change since the Industrial Revolution? There is an increase in carbon dioxide and in the planet’s temperature.[12] Glaciers are melting and sea levels are rising.[13] Artic sea ice areas are decreasing, with 2012 as the lowest on record, which is denoted in the lowest point in the graph by NCAR below.[14]
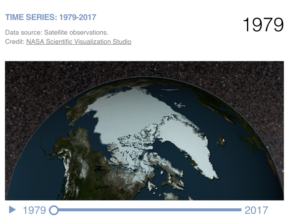
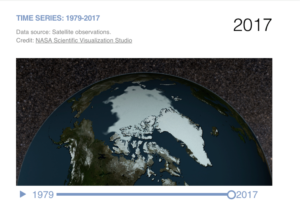
The National Aeronautics and Space Administration (NASA) takes satellite images of artic sea ice.[15] According to their animated time series, the 2017 photograph below reveals less artic sea ice than the1979 photograph.[16] Further, according to the most recent IPCC report in 2014, “Human influence on the climate system is clear, and recent 70-246 anthropogenic emissions of greenhouse gases are the highest in history. Recent climate changes have had widespread impacts on human and natural systems.”[17]
Measures
Scientists use observations and theoretical models to understand changes in the climate. Key observable measures include the Global Surface Temperature and Ocean Heat Content. In the following sections, these measures are defined and analyzed.
Global Surface Temperature
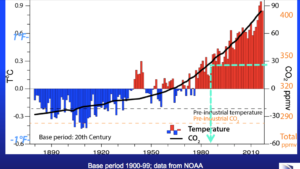
According to the National Oceanic and Atmospheric Administration (NOAA), a temperature anomaly signifies a departure from a specific reference value.[18] Reference values allow for a more accurate representation of temperature patterns within regions.[19] A positive anomaly indicates an observed temperature warmer than that reference value.[20] A negative anomaly reflects an observed temperature cooler than that reference value.[21] The global temperature anomaly provides a measure based on average global temperatures compared to a specified reference value.[22] The global surface temperature is based on land surface and sea surface temperatures.[23]
If you look at the graph below, this measure reveals an overall upward trend (see black line across the graph) with 2016 as the warmest year on record.[24] In 2016, there was a 1.2 degrees Celsius rise above pre-industrial levels.[25] The international community set a goal through the Paris Agreement (2015) to keep the global mean surface temperature increase below two degrees Celsius above pre-industrial levels and to limit the temperature increase even further to 1.5 degrees Celsius.[26] Government policies and actions must be directed at maintaining the global surface temperature to reach the Paris goal.[27]
Ocean Heat Content
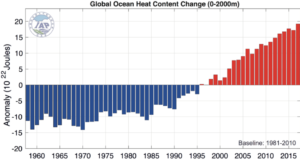
The Earth’s energy imbalance drives the ongoing global warming and can best be assessed from changes in Ocean Heat Content.[28] Ocean Heat Content measures the heat stored in the ocean. It is measured from the surface of the ocean to 700m, which reflects the 1967 to 2002 measures, and from the surface to 2000m, which reflects 2003 to present.[29] If the ocean absorbs more heat than it releases, the Ocean Heat Content increases. According the graph below, the ocean heat content has been increasing since the 1990s, with 2017 as the warmest year on record.[30]
Further, natural variability is the element of uncertainty in climate changes within a certain range because the components of the climate are never in perfect equilibrium.[31] Climate scientists are therefore interested in deviations from that natural variability to explain other causes of climate change. Natural variability, according to Dr. Trenberth, is a lot less for Ocean Heat Content than for global mean surface temperature.[32]
Climate Models
In addition to the measures above, climate scientists can run models to assess differences in global surface temperature in the absence of an increase of carbon dioxide in the atmosphere.[33] For Dr. Trenberth, these models demonstrate that around the 1960s and 1970s, global warming emerged from the noise of natural variability.[34]
Extreme Weather Events
What explains hurricanes such as Harvey, Irma, and Maria? Hurricanes are natural, but they are intensified because of changes in the climate.[35] According to Dr. Trenberth, hurricanes feed off the sea temperatures.[36] When the ocean warms, water from the surface of the ocean then evaporates to cool the ocean, adding warm moist air, or vapor, into the atmosphere.[37] Rising air condenses the water vapor, which produces strong updrafts, drawing in more air.[38] The updraft creates clouds that lead to thunderstorms.[39] Then air spirals into the thunderstorm at the bottom and then out at the top.[40] The storm strengthens and strong surface winds increase evaporation, rainfall, and energy into the storm.[41]
For Dr. Trenberth, the increase in Ocean Heat Content results in evaporative cooling, which releases additional moisture into the atmosphere.[42] That moisture results in heavy rain that releases latent heat.[43] That heat is redistributed by winds and can radiate.[44] The moisture from an evaporating ocean gives fuel to hurricanes, creating an extreme weather event.[45] For example, if we look at Hurricane Harvey, the total rainfall, which was 140.7 mm, or 4.65´1020 J of latent energy in rainfall, matches the amount of Ocean Heat Content lost after the hurricane.[46] Therefore, Dr. Trenberth determined that if the Ocean Heat Content had been less, then rainfall would have been less.[47]
Dr. Trenberth’s Conclusions & Recommendations
Dr. Trenberth emphasizes that human activities are the dominant cause of the observed warming of the Earth.[48] Accordingly, he suggests that there is likely a human fingerprint on the extreme nature of recent hurricanes.[49] Hurricane Harvey caused approximately 30 billion USD in damages (insured and uninsured losses)[50], Hurricane Irma caused approximately 50 billion USD in damages (insured and uninsured losses)[51], and Hurricane Maria exceeded 63 billion USD damages (estimate for insured losses only).[52]
Dr. Trenberth recommends that to avoid the costs of hurricanes, we should: stop building in flood plains, adhere to strict building codes, manage drainage systems, plan evacuation routes, and plan emergency shelters.[53] He also stresses that while we do need mitigation and adaptation strategies to respond to climate change, we also need information.[54]
Read more on Dr. Trenberth’s work here: http://www.cgd.ucar.edu/staff/trenbert/#research.
- http://www.cgd.ucar.edu/staff/trenbert/Presentations/Trenberth_Steamboat_Jan18.min.pdf↑
- http://www.cgd.ucar.edu/staff/trenbert/#research↑
- http://www.cgd.ucar.edu/staff/trenbert/#research↑
- http://www.ipcc.ch/↑
- http://www.ipcc.ch/↑
- http://www.ipcc.ch/↑
- http://www.ipcc.ch/↑
- http://unfccc.int/bodies/body/6383.php↑
- http://www.cgd.ucar.edu/staff/trenbert/Presentations/Trenberth_Steamboat_Jan18.min.pdf↑
- http://www.cgd.ucar.edu/staff/trenbert/Presentations/Trenberth_Steamboat_Jan18.min.pdf↑
- https://climate.nasa.gov/scientific-consensus/#*↑
- http://www.cgd.ucar.edu/staff/trenbert/Presentations/Trenberth_Steamboat_Jan18.min.pdf↑
- http://www.cgd.ucar.edu/staff/trenbert/Presentations/Trenberth_Steamboat_Jan18.min.pdf↑
- http://www.cgd.ucar.edu/staff/trenbert/Presentations/Trenberth_Steamboat_Jan18.min.pdf↑
- https://climate.nasa.gov/vital-signs/arctic-sea-ice/↑
- https://climate.nasa.gov/vital-signs/arctic-sea-ice/↑
- https://www.ipcc.ch/pdf/assessment-report/ar5/syr/AR5_SYR_FINAL_SPM.pdf↑
- https://www.ncdc.noaa.gov/monitoring-references/faq/anomalies.php↑
- https://www.ncdc.noaa.gov/monitoring-references/faq/anomalies.php↑
- https://www.ncdc.noaa.gov/monitoring-references/faq/anomalies.php↑
- https://www.ncdc.noaa.gov/monitoring-references/faq/anomalies.php↑
- https://www.ncdc.noaa.gov/monitoring-references/faq/anomalies.php↑
- https://www.ncdc.noaa.gov/monitoring-references/faq/anomalies.php↑
- http://www.cgd.ucar.edu/staff/trenbert/Presentations/Trenberth_Steamboat_Jan18.min.pdf↑
- https://www.ncdc.noaa.gov/cag/global/time-series/globe/land_ocean/ytd/12/1880-2017↑
- http://unfccc.int/paris_agreement/items/9485.php; https://public.wmo.int/en/media/press-release/provisional-wmo-statement-status-of-global-climate-2016↑
- http://climateactiontracker.org/↑
- http://advances.sciencemag.org/content/3/3/e1601545.full↑
- https://www.ncdc.noaa.gov/cdr/oceanic/ocean-heat-content
- http://www.cgd.ucar.edu/staff/trenbert/Presentations/Trenberth_Steamboat_Jan18.min.pdf↑
- https://www.ipcc.ch/ipccreports/tar/wg1/042.htm↑
- http://www.cgd.ucar.edu/staff/trenbert/Presentations/Trenberth_Steamboat_Jan18.min.pdf↑
- http://www.cgd.ucar.edu/staff/trenbert/Presentations/Trenberth_Steamboat_Jan18.min.pdf↑
- http://www.cgd.ucar.edu/staff/trenbert/Presentations/Trenberth_Steamboat_Jan18.min.pdf↑
- http://www.cgd.ucar.edu/staff/trenbert/Presentations/Trenberth_Steamboat_Jan18.min.pdf↑
- http://www.cgd.ucar.edu/staff/trenbert/Presentations/Trenberth_Steamboat_Jan18.min.pdf↑
- http://www.cgd.ucar.edu/staff/trenbert/Presentations/Trenberth_Steamboat_Jan18.min.pdf↑
- http://www.cgd.ucar.edu/staff/trenbert/Presentations/Trenberth_Steamboat_Jan18.min.pdf↑
- http://www.cgd.ucar.edu/staff/trenbert/Presentations/Trenberth_Steamboat_Jan18.min.pdf↑
- http://www.cgd.ucar.edu/staff/trenbert/Presentations/Trenberth_Steamboat_Jan18.min.pdf↑
- http://www.cgd.ucar.edu/staff/trenbert/Presentations/Trenberth_Steamboat_Jan18.min.pdf↑
- http://www.cgd.ucar.edu/staff/trenbert/Presentations/Trenberth_Steamboat_Jan18.min.pdf↑
- http://www.cgd.ucar.edu/staff/trenbert/Presentations/Trenberth_Steamboat_Jan18.min.pdf↑
- http://www.cgd.ucar.edu/staff/trenbert/Presentations/Trenberth_Steamboat_Jan18.min.pdf↑
- http://www.cgd.ucar.edu/staff/trenbert/Presentations/Trenberth_Steamboat_Jan18.min.pdf↑
- http://www.cgd.ucar.edu/staff/trenbert/Presentations/Trenberth_Steamboat_Jan18.min.pdf↑
- http://www.cgd.ucar.edu/staff/trenbert/Presentations/Trenberth_Steamboat_Jan18.min.pdf↑
- http://www.cgd.ucar.edu/staff/trenbert/Presentations/Trenberth_Steamboat_Jan18.min.pdf↑
- http://www.cgd.ucar.edu/staff/trenbert/Presentations/Trenberth_Steamboat_Jan18.min.pdf↑
- http://www.bbc.com/news/business-41075704↑
- https://www.reuters.com/article/us-hurricane-irma-corelogic/corelogic-estimates-hurricane-irma-property-damage-at-42-5-65-billion-idUSKCN1BU28T↑
- https://www.wsj.com/articles/hurricane-maria-caused-as-much-as-85-billion-in-insured-losses-air-worldwide-says-1506371305↑
- http://www.cgd.ucar.edu/staff/trenbert/Presentations/Trenberth_Steamboat_Jan18.min.pdf↑
- http://www.cgd.ucar.edu/staff/trenbert/Presentations/Trenberth_Steamboat_Jan18.min.pdf↑

